
Visualise machines resource usage in beautiful Grafana dashboards and create e-mail alerts to notify you when services fail.
Infrastructure twist#
For every post before this one we’ve been deploying the containers into our VMs with Ansible, I have explained the interactions between every VM in detail.
In this post I’ll be showing the deployment with docker-compose in my own personal infrastructure to monitor various things in one of my VPS boxes as well as the server in my house.
The goal#
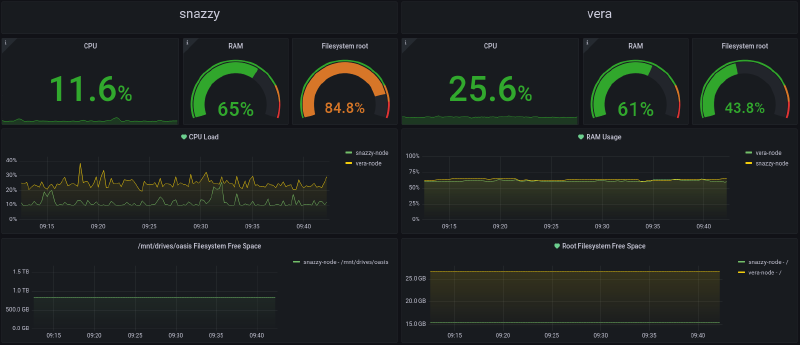
As you can see in the picture, that is a Grafana dashboard which shows CPU, RAM and disk usage on 2 boxes (snazzy and vera).
To achieve this we’ll be using a software stack comprised of Prometheus, node-exporter and the aforementioned Grafana. Prometheus and Grafana are run in my homeserver, while node-exporter runs both in my homeserver and the VPS box.
Preparation#
Let’s install the packages we will need with this command:
$ apt install docker-ce container.io docker-composeAlso to make sure the Docker service is enabled and started we’ll run this command:
$ systemctl enable --now docker.serviceNote: I run Taefik as my edge router and reverse-proxy, this will become apparent in the next section when we start writing docker-compose files. Deploying a reverse-proxy is out of the scope of this post so I’ll just assume the reader has one working. It doesn’t have to be Traefik; it could be nginx, Apache, Caddy or any other.
node-exporter#
Let’s create a directory where we’ll store the files necessary for the stack, I like to keep my Docker-related files in /srv so I’ll create a directory called metrics there. This is done in both boxes we’ll be working with.
mkdir -p /srv/metrics && cd /srv/metricsI’ll first deal with the VPS since it only needs node-exporter, then expand the compose file for the server which will host Prometheus and Grafana.
Create a file called docker-compose.yml in this directory with the following content:
root@vera:~ $ cat /srv/metrics/docker-compose.yml
version: "3.7"
services:

  node-exporter:
    container_name: "node-exporter"
    hostname: "node-exporter"
    image: "quay.io/prometheus/node-exporter:latest"
    restart: "unless-stopped"
    volumes:
      - "/etc/localtime:/etc/localtime:ro"
      - '/:/host:ro,rslave'
    command:
      - '--path.rootfs=/host'
    pid: "host"
    privileged: "true"
    healthcheck:
      test: "wget --no-verbose --tries=1 --spider 127.0.0.1:9100"
      interval: "1m30s"
      timeout: "10s"
      retries: "3"
    labels:
      - "traefik.enable=true"
      - "traefik.http.routers.nodeexporter.tls=true"
      - "traefik.http.routers.nodeexporter.entrypoints=websecure"
      - "traefik.http.routers.nodeexporter.rule=Host(`nodeexporter.efym.net`)"
      - "traefik.http.services.nodeexporter.loadbalancer.server.port=9100"
      - "traefik.http.routers.nodeexporter.middlewares=metrics-auth@file"
    networks:
      - "rawr"
    dns:
      - "10.3.0.100"

networks:
  rawr:
    name: "rawr"
    ipam:
      driver: "default"
      config:
        - subnet: "10.3.0.0/24"
Now from the same directory we run:
root@vera:~ $ docker-compose up -dAfter the Docker image is pulled from its repository the container will start in a couple of seconds.
This compose file mounts the root directory of our server (/) inside the container’s path we defined, in this case /host.
This allows the container to monitor the host box’s aspects we want to display on our Grafana dashboard. It is also mounted as read-only, so the container cannot actually make any changes the our host’s filesystem.